What can I see on my dashboard?
Your dashboard is the first page of your Trendful Admin. It summarizes your offers, customers, shipments, payouts and inventory for the period you choose.
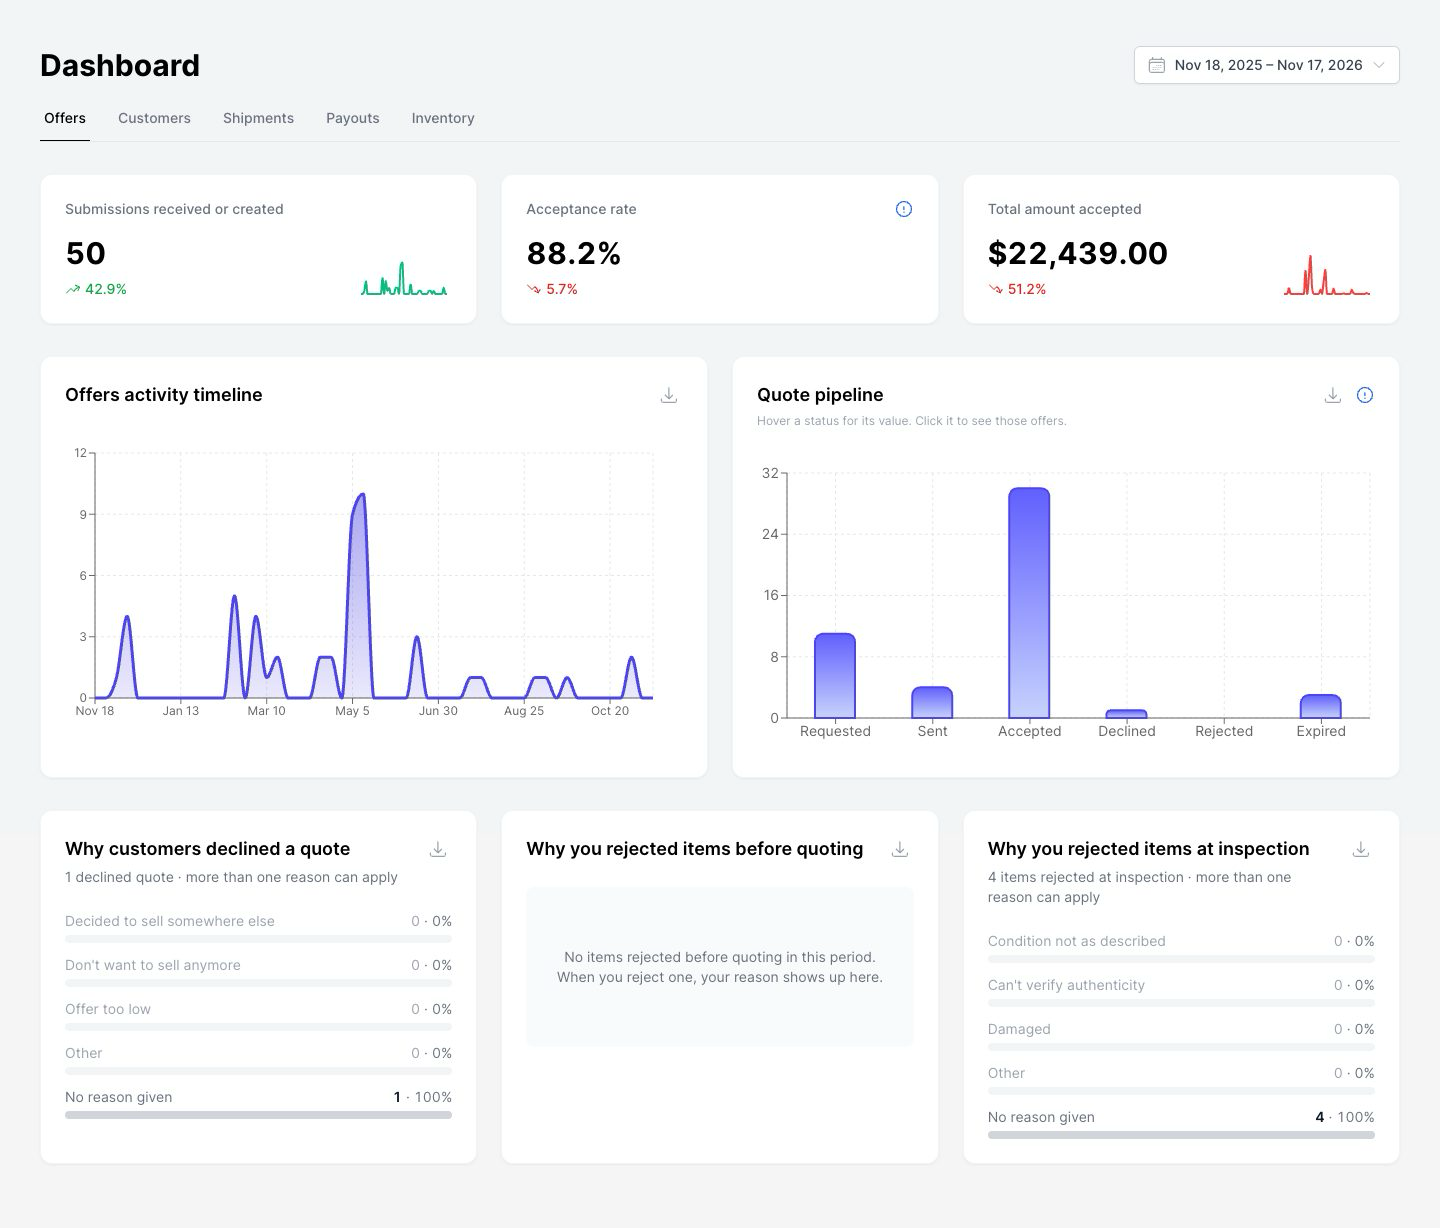
Choosing a period
Click the date button at the top right to change the period. You can pick Last 7 days, Last 30 days, Last 90 days or This month, or click a start date and an end date on the calendar for any range up to one year.
Every number is compared with the same length of time just before. For example, with Last 30 days selected, the percentage under a number compares it with the 30 days before that.
The tabs
- “Offers” shows submissions received or created, your acceptance rate and the total amount accepted, with a timeline and the quote pipeline. Below the charts, three cards show why offers were declined or rejected. See Where can I see why offers were declined or rejected?
- “Customers” shows how many customers submitted in the period, split into first-time and returning customers, and how many new accounts were created. It also splits those customers by tag, payout method and country, and lists your top customers by amount accepted.
- “Shipments” shows shipments created, your delivery rate and the shipment pipeline.
- “Payouts” shows payouts created, total payouts, the average payout and the payout pipeline.
- “Inventory” shows your listings, average time to sell, total sold and total actively listed. This tab only appears if your plan includes the Inventory Management System.
Customer numbers explained
- “Customers with submissions” is everyone who submitted in the period.
- “First-time customers” submitted in the period and created their account during it.
- “Returning customers” submitted in the period and already had an account before it.
- “New accounts” counts accounts created in the period, whether or not they have submitted yet.
Getting more detail from a chart
Hover a bar in a pipeline chart to see more than the count (see image below):
- In the quote pipeline, each status shows the total value of its offers. Offers that are not accepted yet count at their highest payout option, shown as “Total up to”.
- In the shipment pipeline, each status shows the number of items, the number of shipments they travel in, and the total item value.
- In inventory status, each status shows the number of listings, the total listed (or total sold) and the total cost.
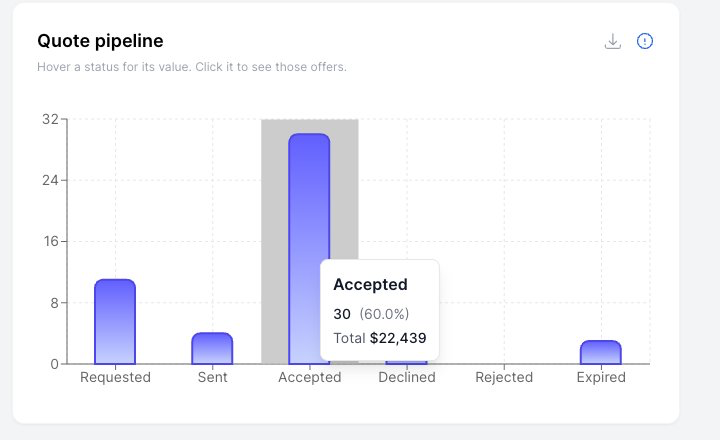
Click a bar to open the matching list. For example, clicking “Declined” in the quote pipeline opens your offers filtered to declined quotes for the same period.
Downloading a chart
Every chart and card with a download icon can be saved as an image. Click the icon at the top right of the card. The image includes the title, your store name and the period.
Good to know
The dashboard counts offers by the date they were received. If a very long period holds more activity than the dashboard can count at once, a notice appears at the top and the numbers cover only part of the period. Pick a shorter period to get exact figures.
More about Trendful Admin
- Can I generate shipping labels for draft offers and manual quotes?
- How can I change my email and/or password in my admin account?
- How do I change my profile name in my admin account?
- How do I change or add credit cards to my account?
- How do I change the notifications I receive?
- How do I create a Trendful Admin account?
Still stuck? Get in touch or browse all 160 answers.