The state of C2B resale: what 50,000 sellers taught us

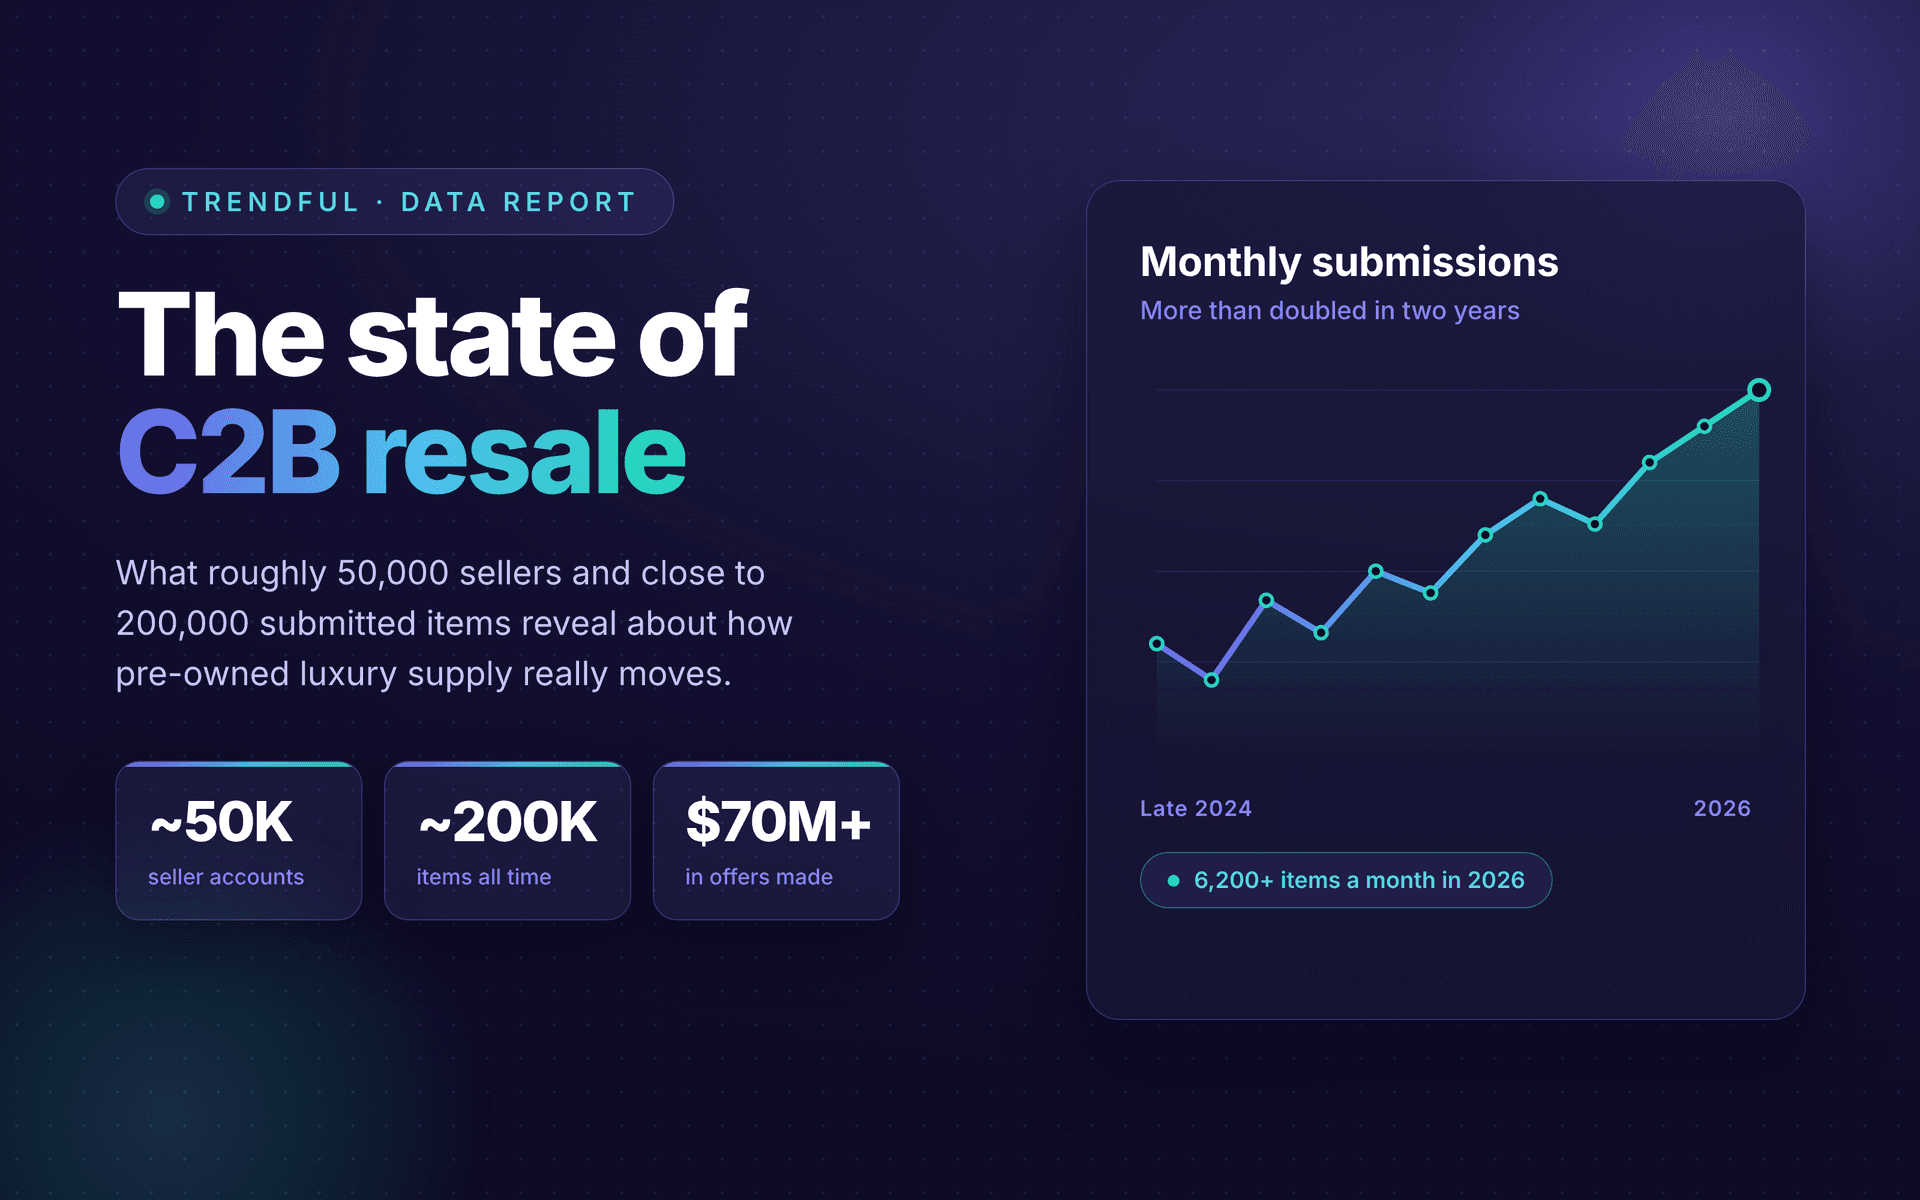
Most numbers written about the resale market are estimates of the whole industry. This is not that. It is a look inside one platform, Trendful, where merchants run their buying operations day to day, and where close to 200,000 items have been submitted by roughly 50,000 seller accounts. When you watch that much C2B acquisition move through one set of pipes, patterns show up that no industry survey can see.
This is our read of those patterns: how fast supply is growing, what sellers bring, how they want to be paid, which offers they accept, and how often they come back. Every figure here is Trendful platform data, rounded for readability.
How to read this data
One caveat up front, and it matters for every number below. This reflects the merchants who run on Trendful, who skew toward established, high-performing resale operations. It is not an industry-wide census, and it is not a random sample of the market. Read each figure as "what we see across serious operators on our platform," not as a universal law of resale. We also report everything in aggregate and never name or rank an individual merchant.
With that framing in place, here is what the data shows.
Supply keeps growing, and it has a season
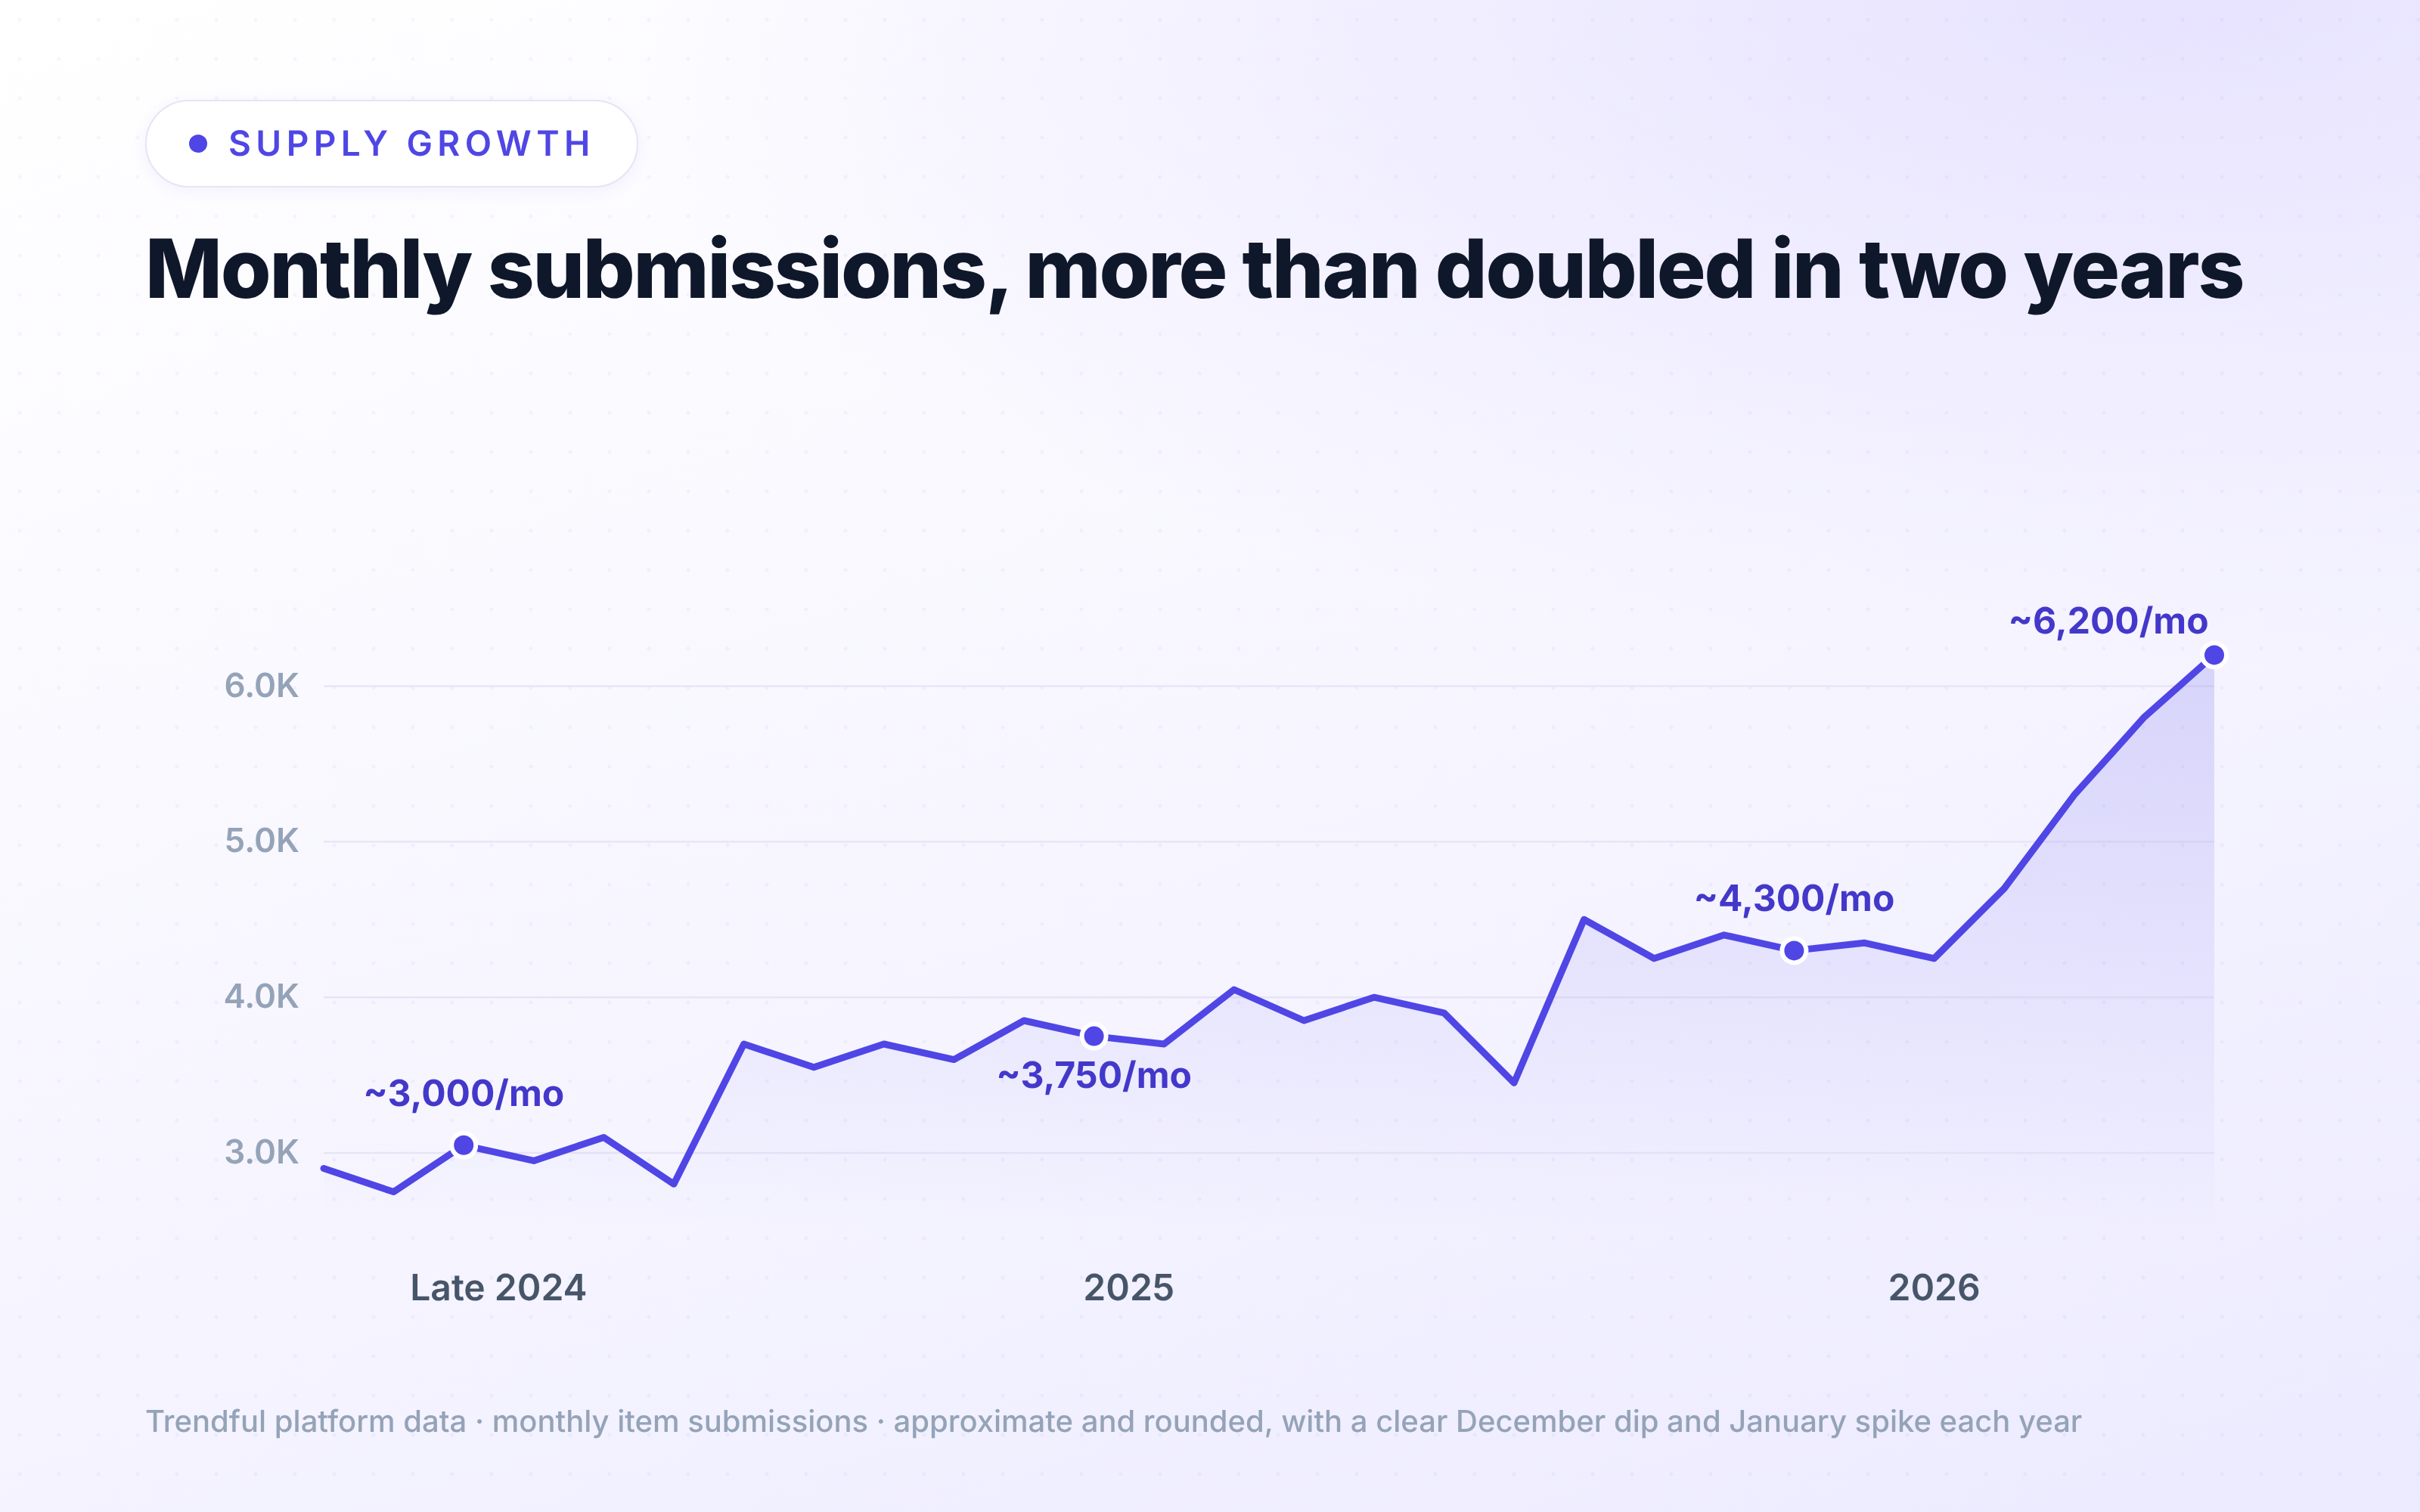
Submissions per month have more than doubled over the last two years. Late 2024 ran around 3,000 items a month. 2025 averaged closer to 3,750. For much of 2026 the platform held around 4,300 a month, and then over the last four months it climbed sharply to about 6,200, the busiest stretch to date.
The shape is as useful as the slope. Every year there is a clear dip in December and a spike in January. December is quiet because the holidays pull merchants toward selling rather than buying, and sellers are busy with the season too; January rebounds as people clear out closets and the gifts they would rather resell. If you run acquisition, that seasonality is a planning tool: staff and cash up for January, expect a December lull, and do not read either as a trend.
The scale behind the curve
Volume is one way to feel the size of this. Value is another. Across the platform, sellers submit over $20M in merchandise value every month. All time, there is over $70M in offers made to sellers, and $4M+ committed to sellers monthly. Close to 200,000 items have come through from roughly 50,000 seller accounts, with 6,200+ new items arriving every month.
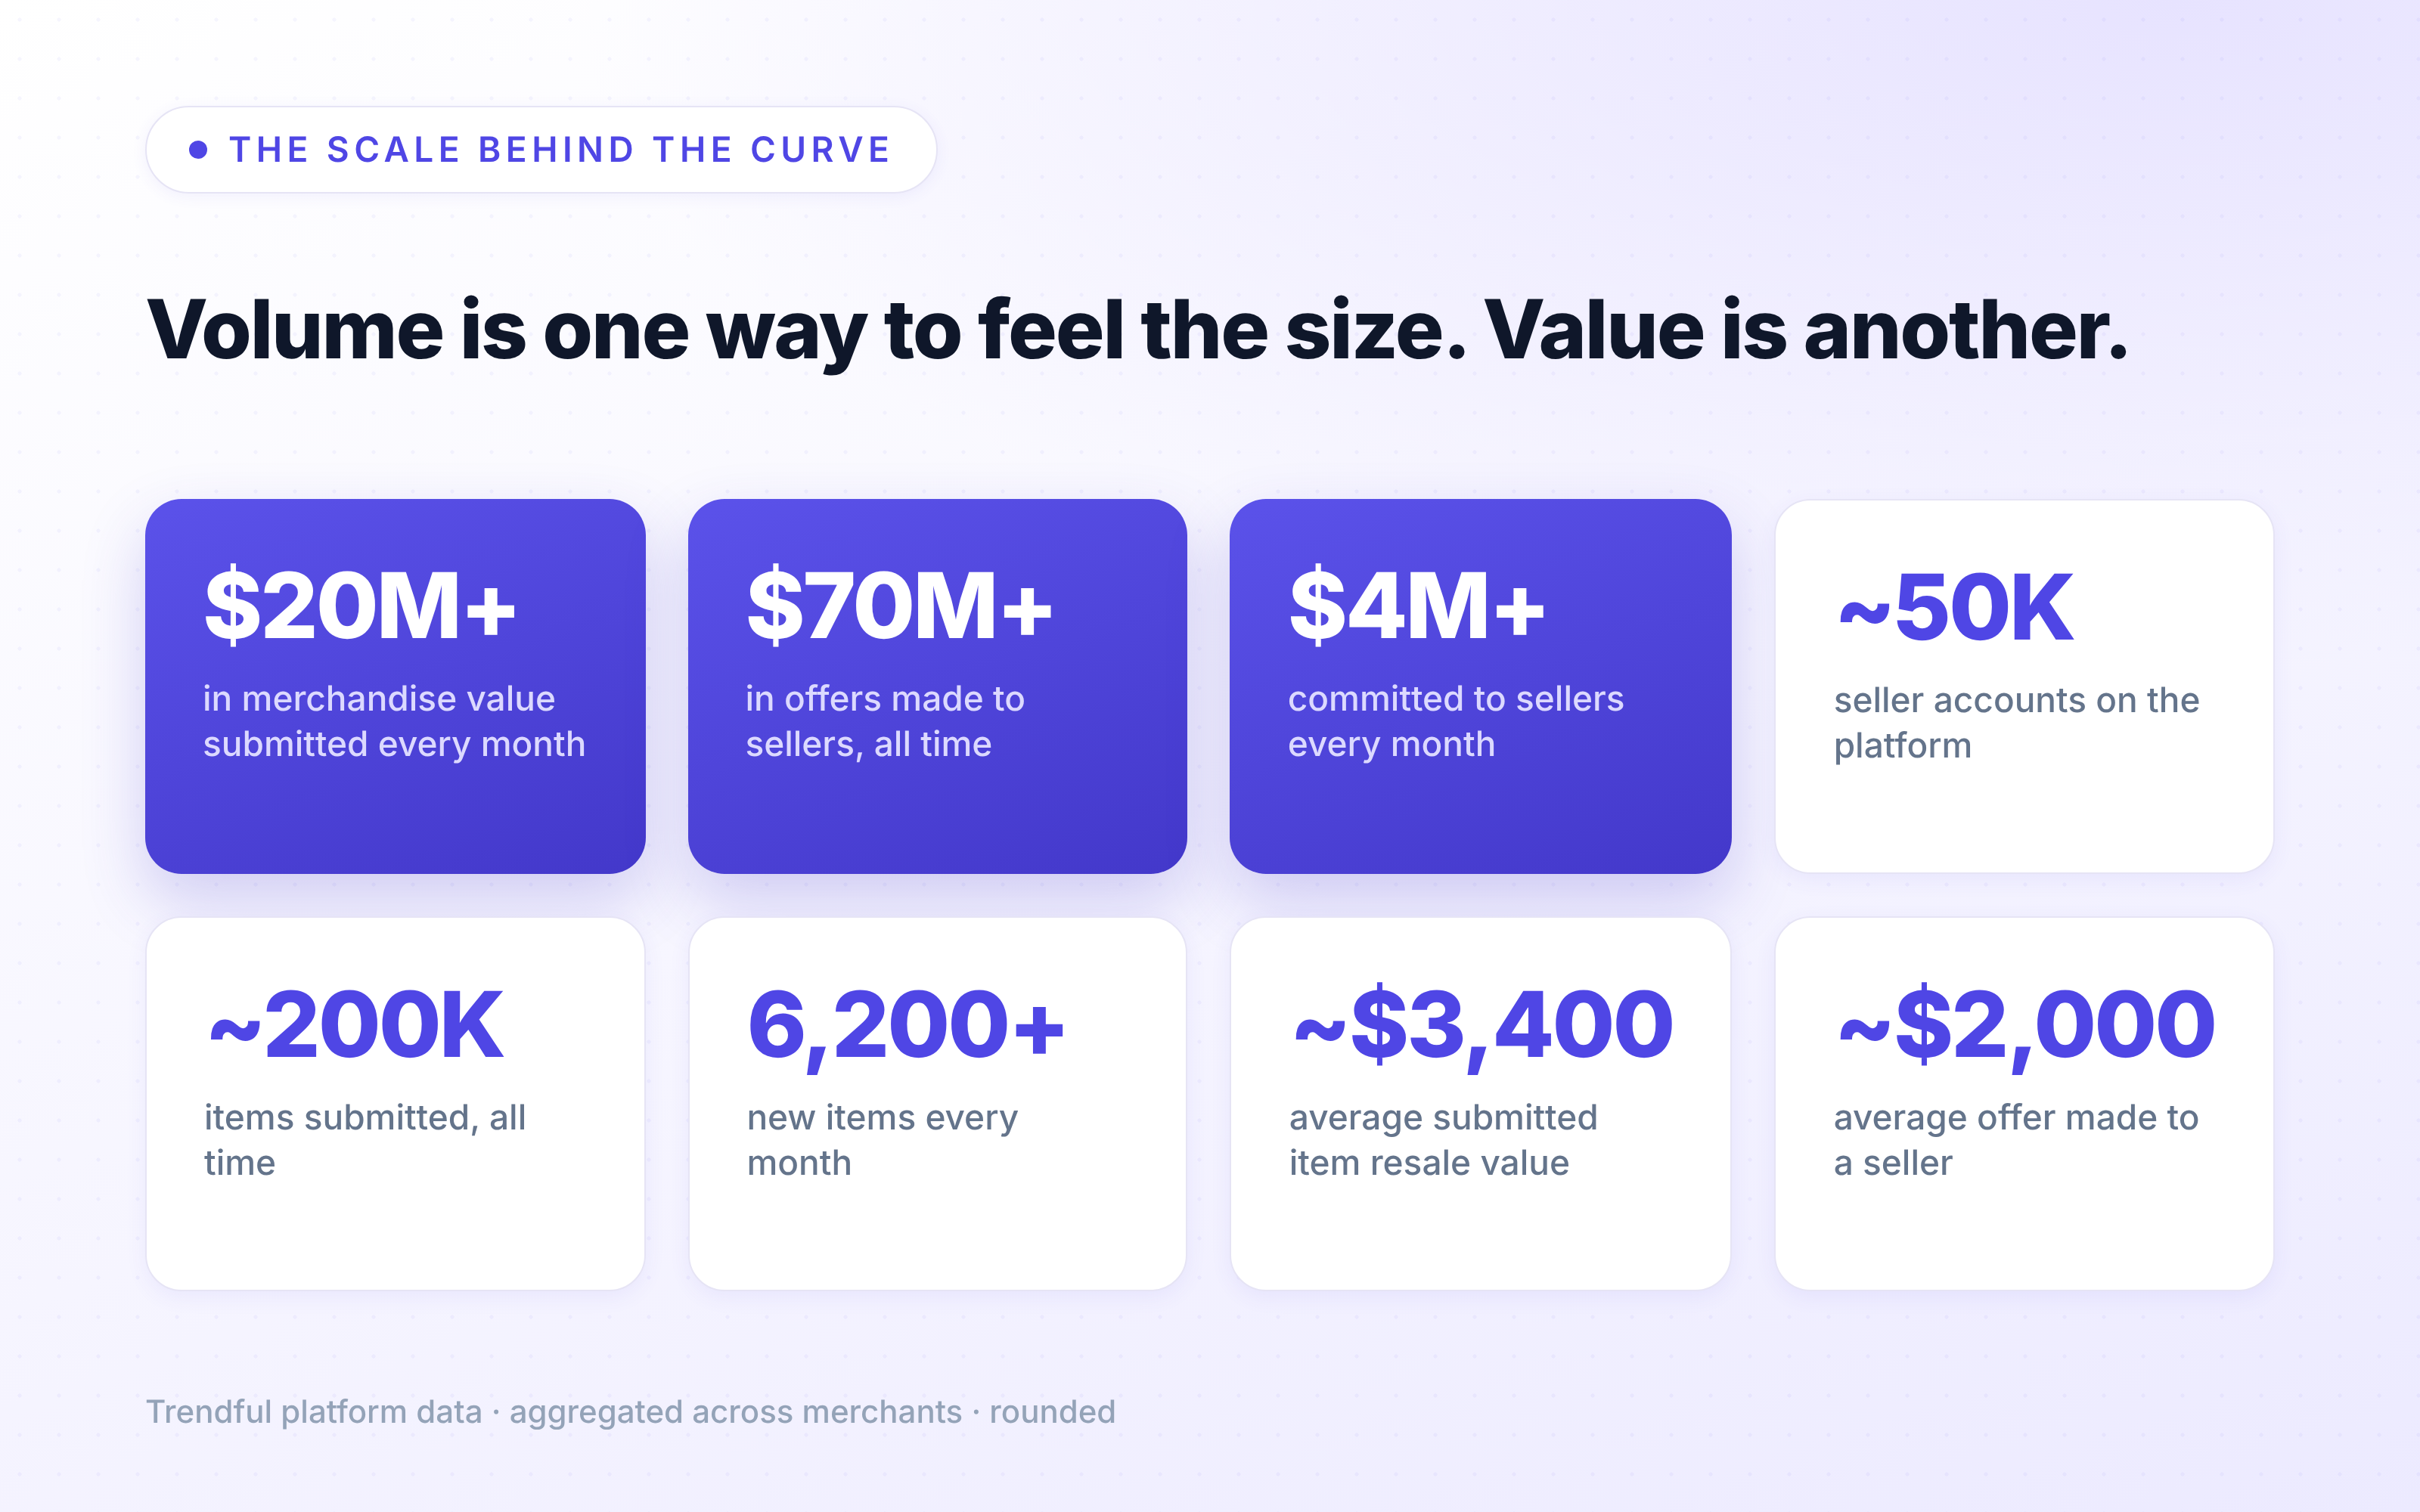
The average submitted item carries a resale value around $3,400, and the average offer made to a seller is around $2,000, though a tail of high-value pieces pulls that average up and the middle half of offers runs roughly $400 to $2,500. Item value and offer, side by side, are the whole C2B thesis in miniature: there is real value sitting in people's closets, and merchants can acquire it at a price that leaves room to operate.
How sellers want to be paid
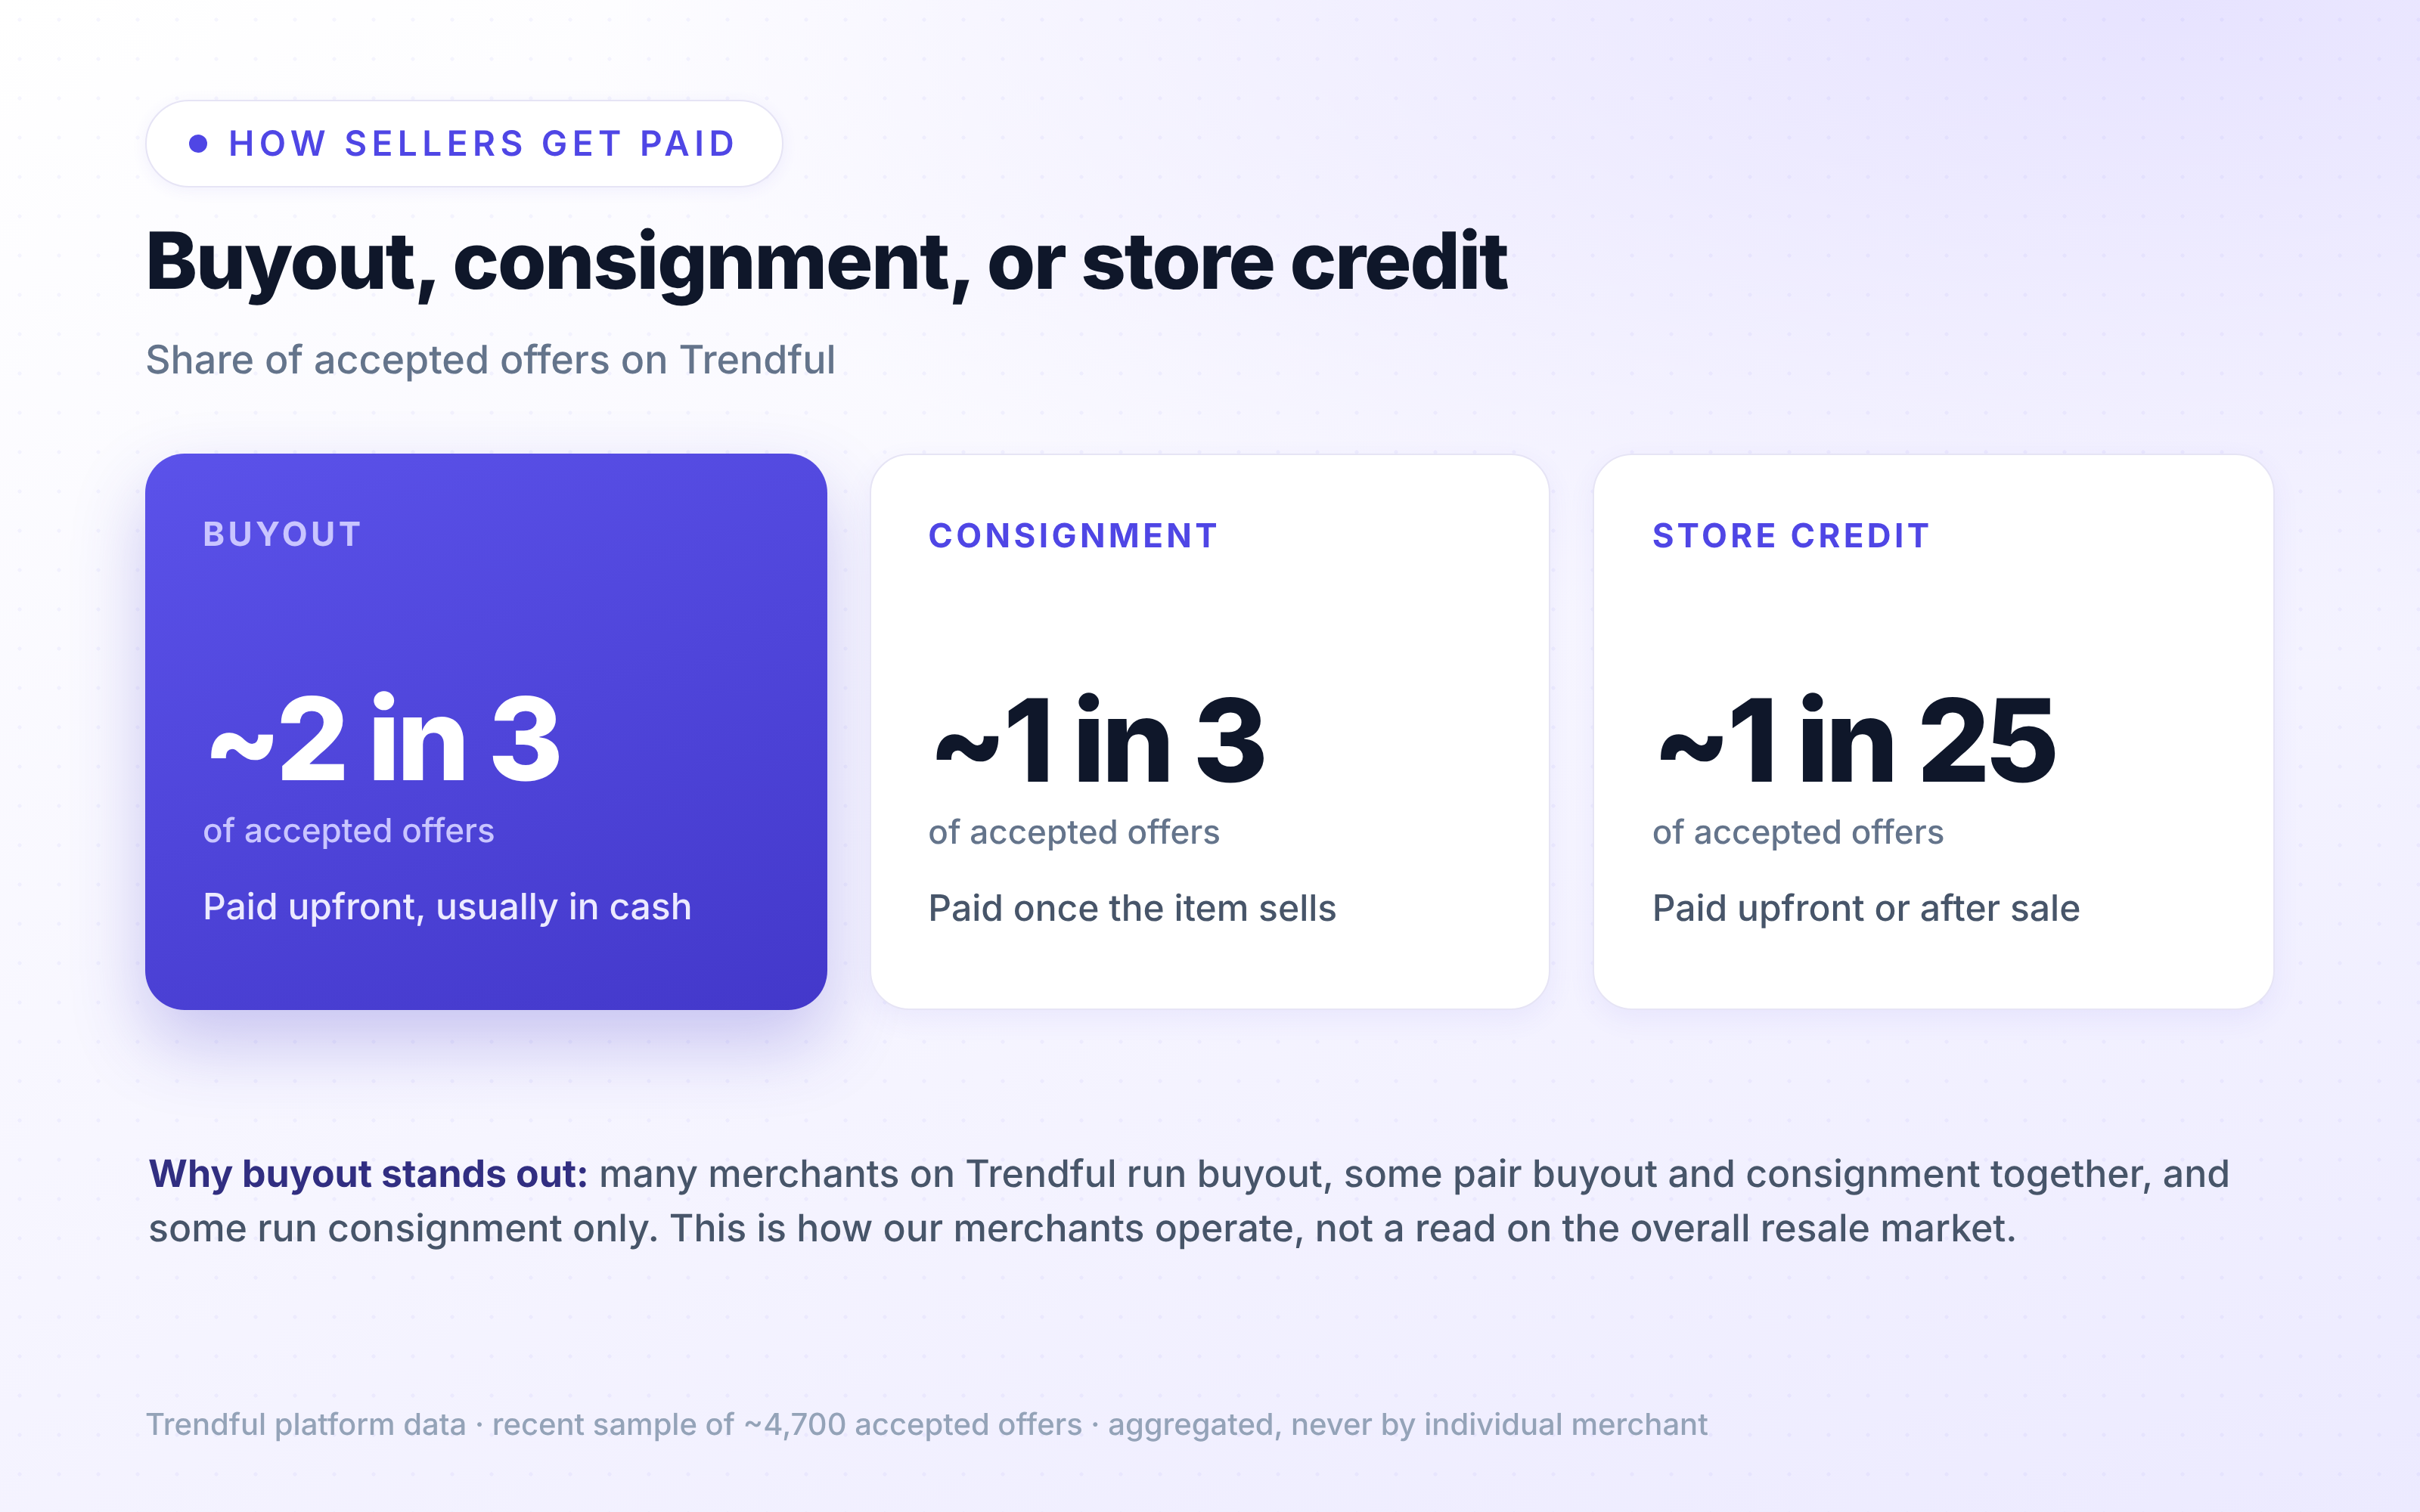
When a seller accepts an offer, the deal takes one of three shapes: a buyout, a consignment, or store credit.
Across a recent sample of about 4,700 accepted offers on Trendful, roughly two thirds were buyouts, where the seller is paid upfront, and about a third were consignment, where the seller is paid once the item sells. Almost all are paid in cash; store credit is a small slice, around 4% or about 1 in 25, and it can ride on top of either a buyout or a consignment rather than being a separate track. One caveat matters here: this is not a read on the overall resale market, only on how merchants using Trendful operate. Many run buyout, some pair buyout and consignment together, and some run consignment only, which is why buyout stands out.
Store credit skews toward turning a seller into a buyer, which is exactly why merchants who offer it watch the loop spin faster.
One clarification, because the word gets overloaded. None of this is "instant quoting." On Trendful, quoting an offer is a deliberate, manual step for most merchants. Automatic instant offers are an optional feature a merchant can switch on, not the default, and the mix above is about buyout versus consignment, not about how fast a quote was sent. Trendful serves merchants running any combination of buyout, consignment, trade-in, and store credit, not consignment shops alone.
What happens to an offer once it is sent
Not every quote turns into a deal, and the breakdown is instructive. Of the quotes that reached a decision, about 55% were accepted, roughly 18% were actively declined, and about 27% expired. Counting still-open sent quotes in the denominator, acceptance sits just under half, around 45%.
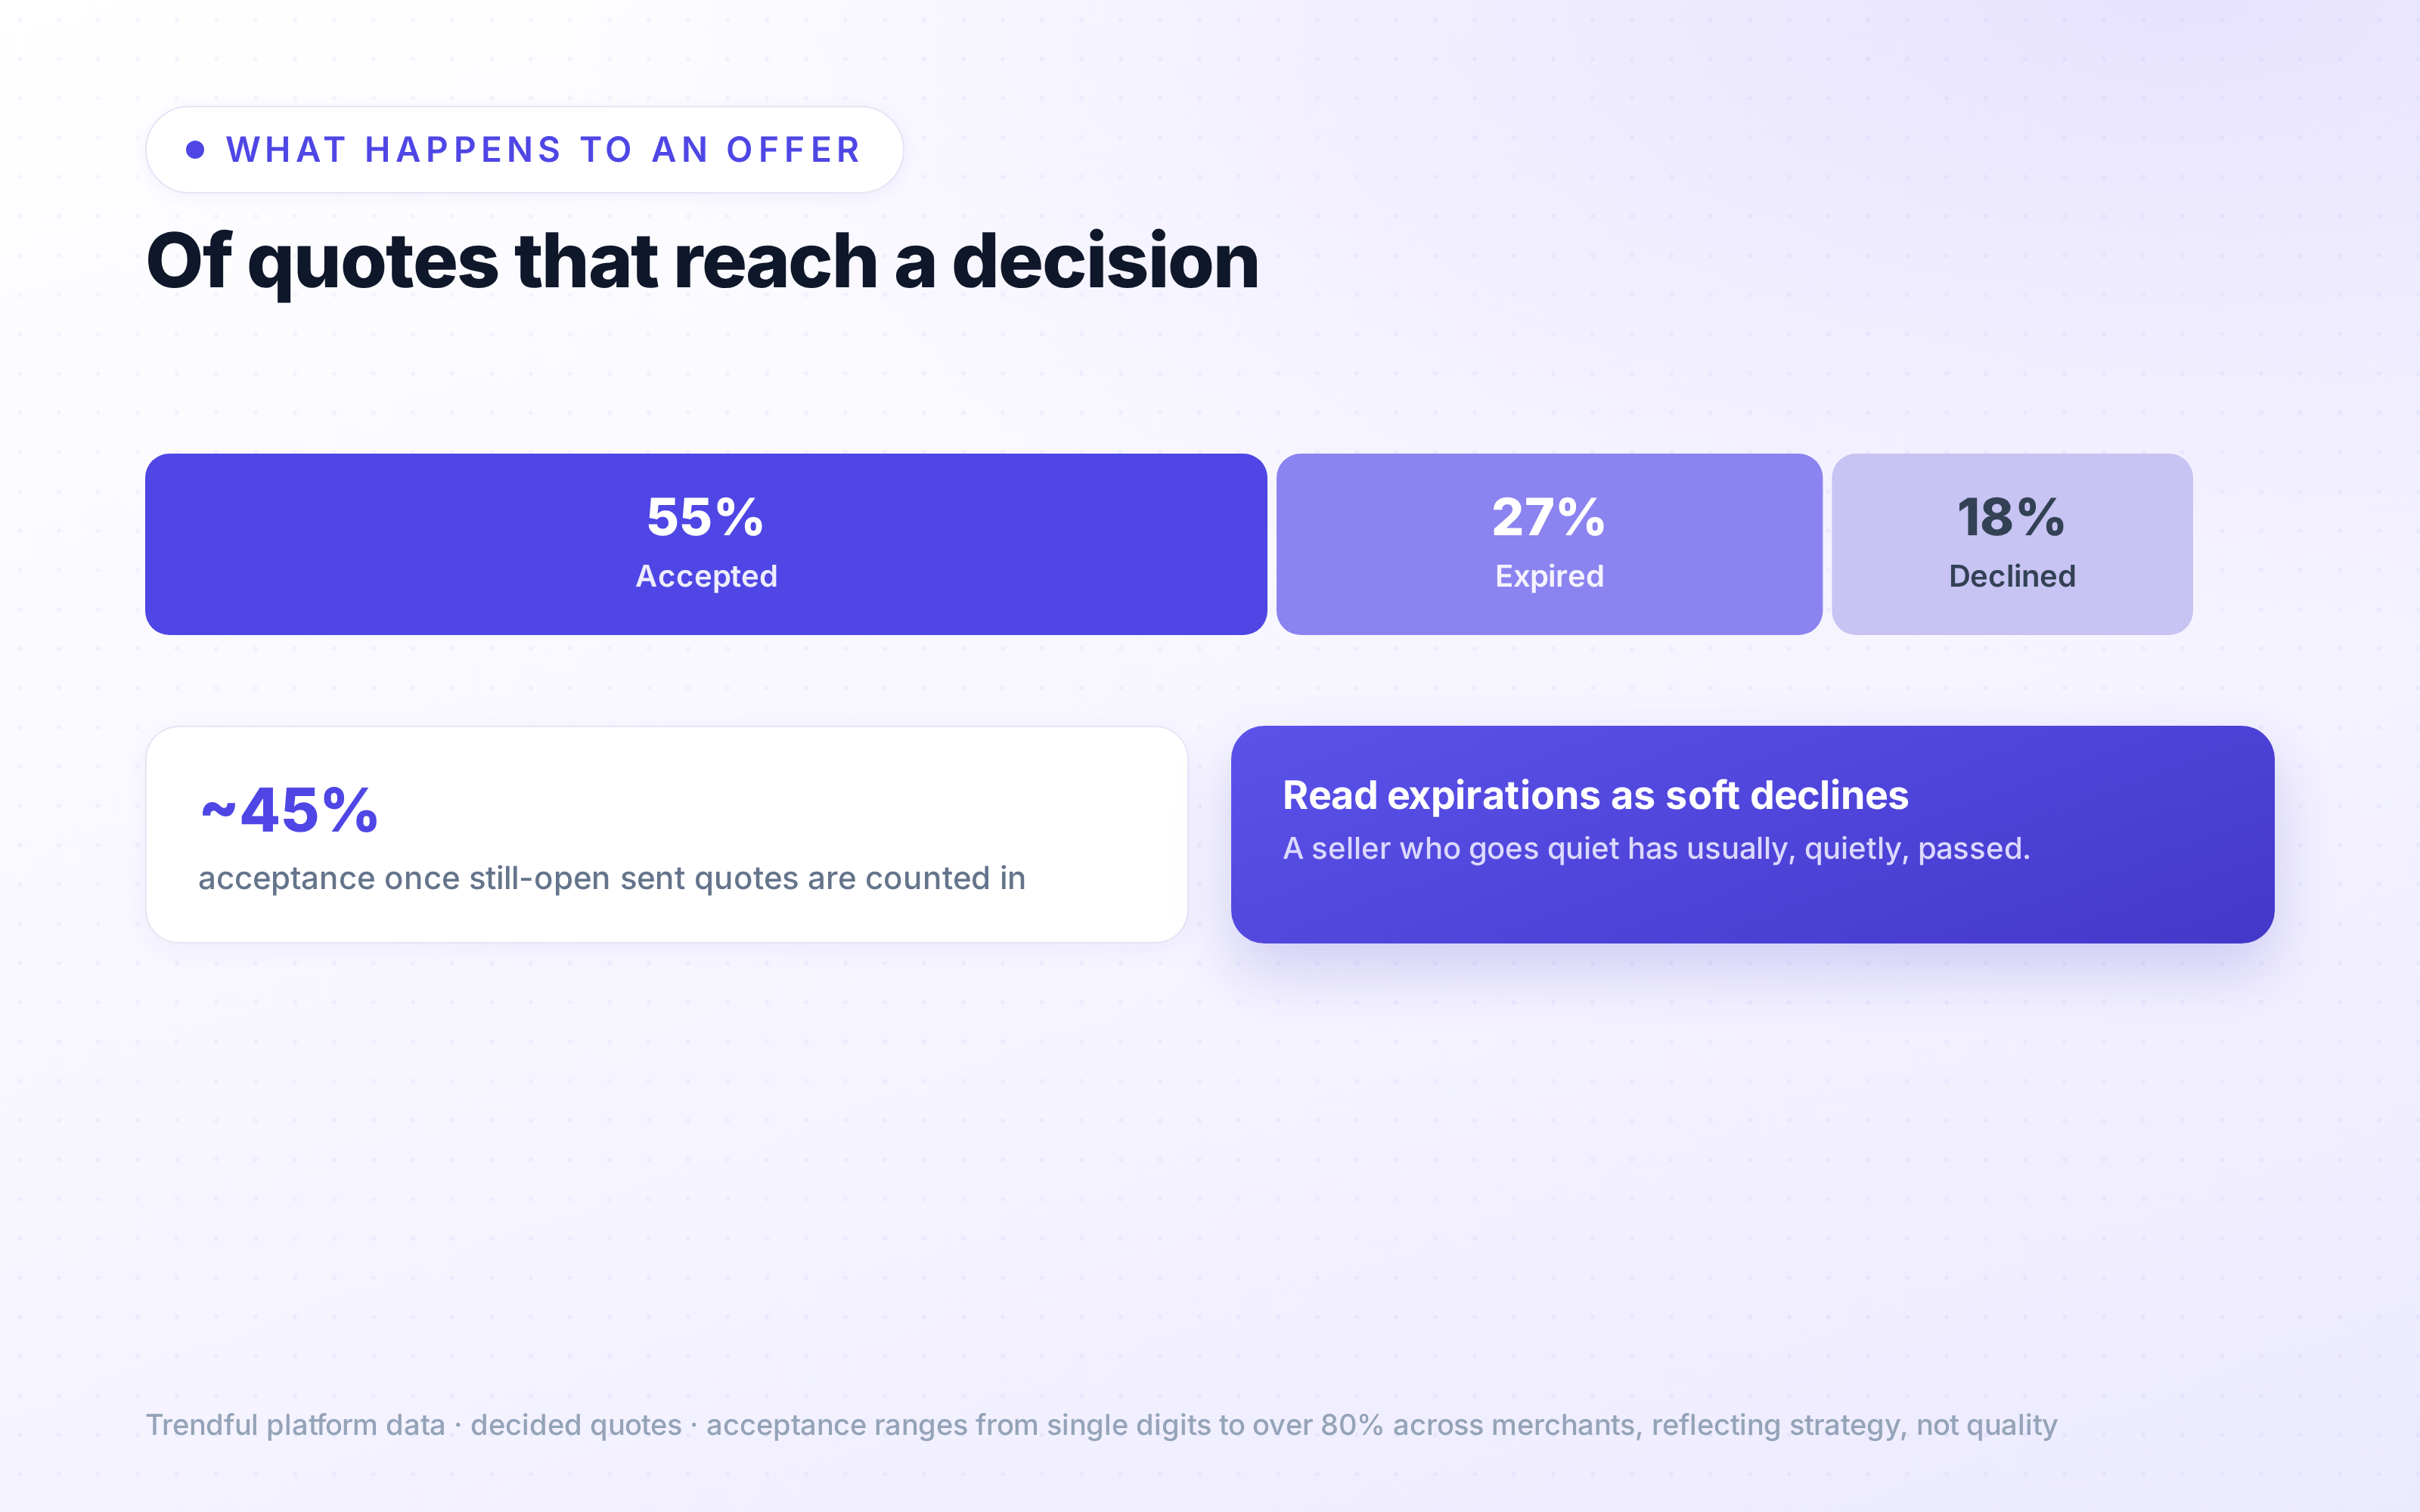
Treat most of those expirations as soft declines rather than lost mail. A seller who is genuinely interested usually acts; one who goes quiet has usually, quietly, passed. Two caveats keep this honest. First, we recently expanded offer reminders to more merchants, so the expiry share may compress in later windows, which means period-over-period comparisons need a grain of salt. Second, acceptance rates range enormously across merchants, from single digits to over 80%. That spread is strategy, not quality: some operators send compelling offers to a known base and expect most to land, while others quote deliberately and case by case. Both are valid ways to run a desk.
Which brands sellers bring, and which offers they take
Here is the pattern only a platform can see. Sort the most-submitted brands by how often their sellers accept an offer and by the median payout those sellers are offered, and the two do not move together at all.
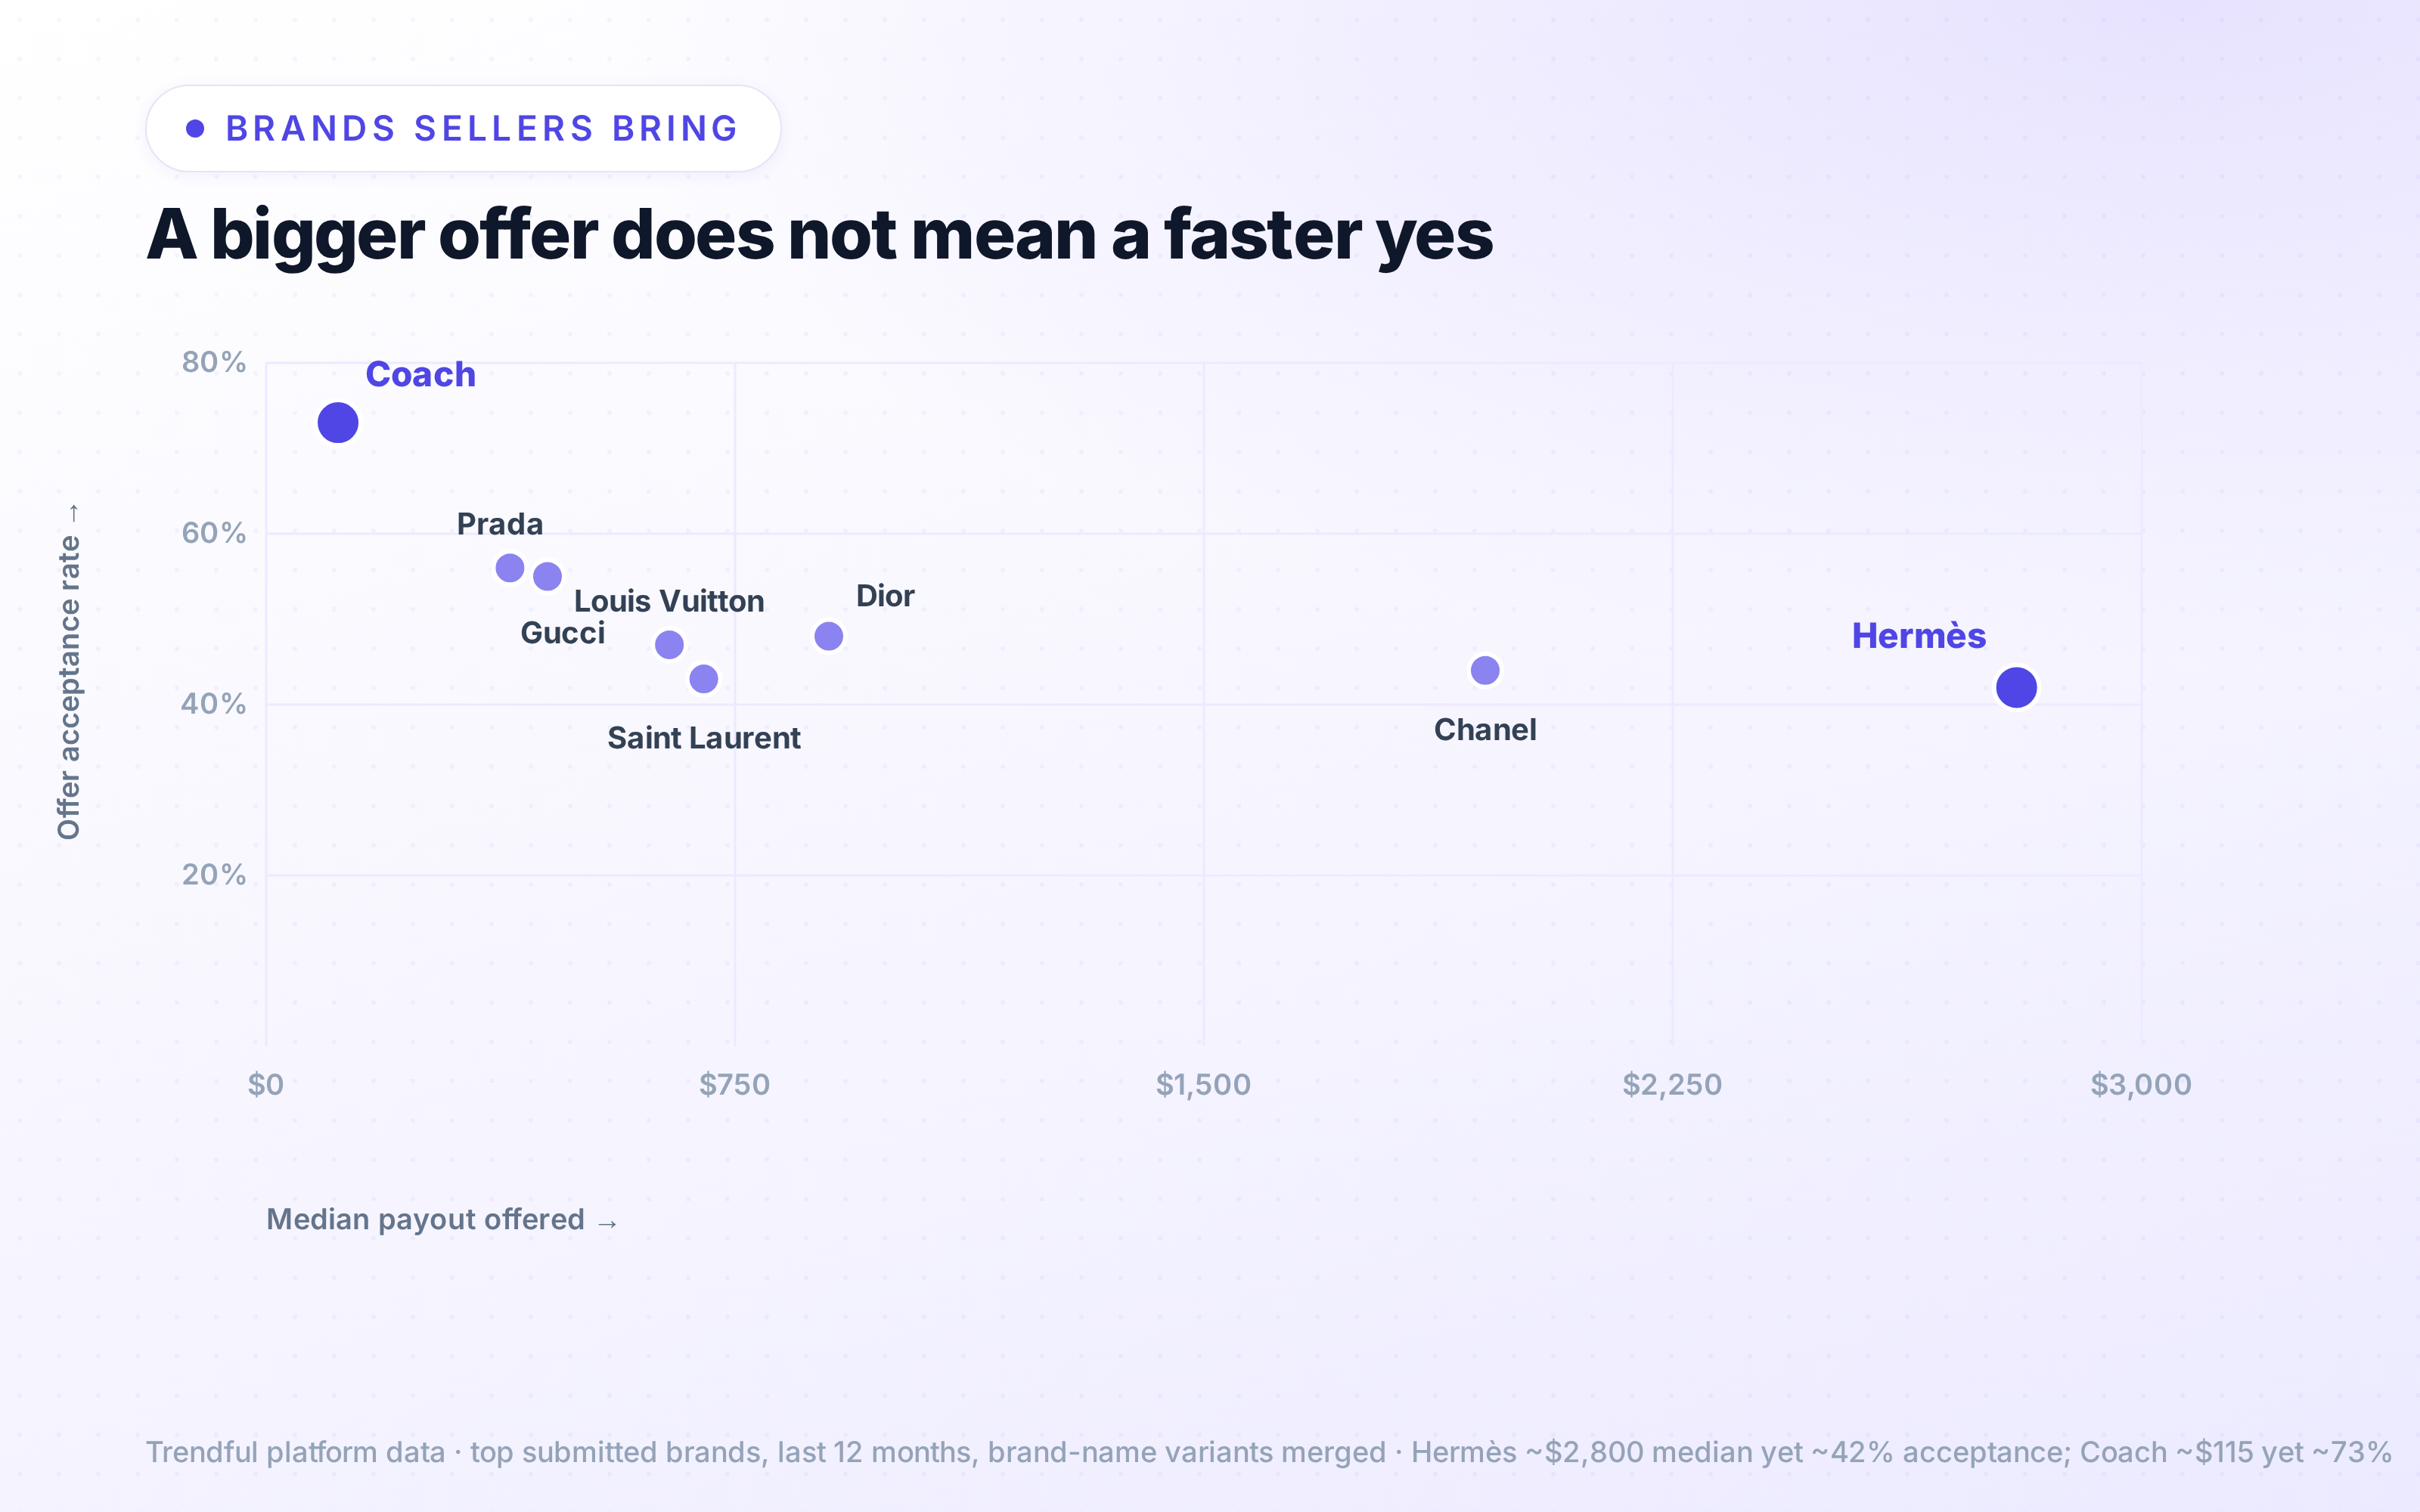
The headline writes itself: Hermès sellers are offered a median around $2,800, roughly 24x what Coach sellers get, yet Coach offers are accepted about 73% of the time versus about 42% for Hermès. High-value sellers negotiate and shop their piece around. Accessible-brand sellers take the money and move on. Chanel and Louis Vuitton sit in the middle on both counts and make up the largest share of volume. It is a dynamic every acquisition desk should price in: the richer the offer, the harder you have to earn the yes.
They come back
The single most important number in C2B is not about any one deal. It is about the second one.
About 1 in 2 sellers return to sell again. When they do, it is rarely the next week: the median gap between a seller's first and second submission is about five weeks, and sellers average roughly two selling sessions with a merchant. That is a patient, high-intent relationship, which is the whole point. A returning seller has effectively zero acquisition cost the second time, because the trust is already built. This is the resale flywheel in the data: do the experience well and close to half your supply reorders itself.
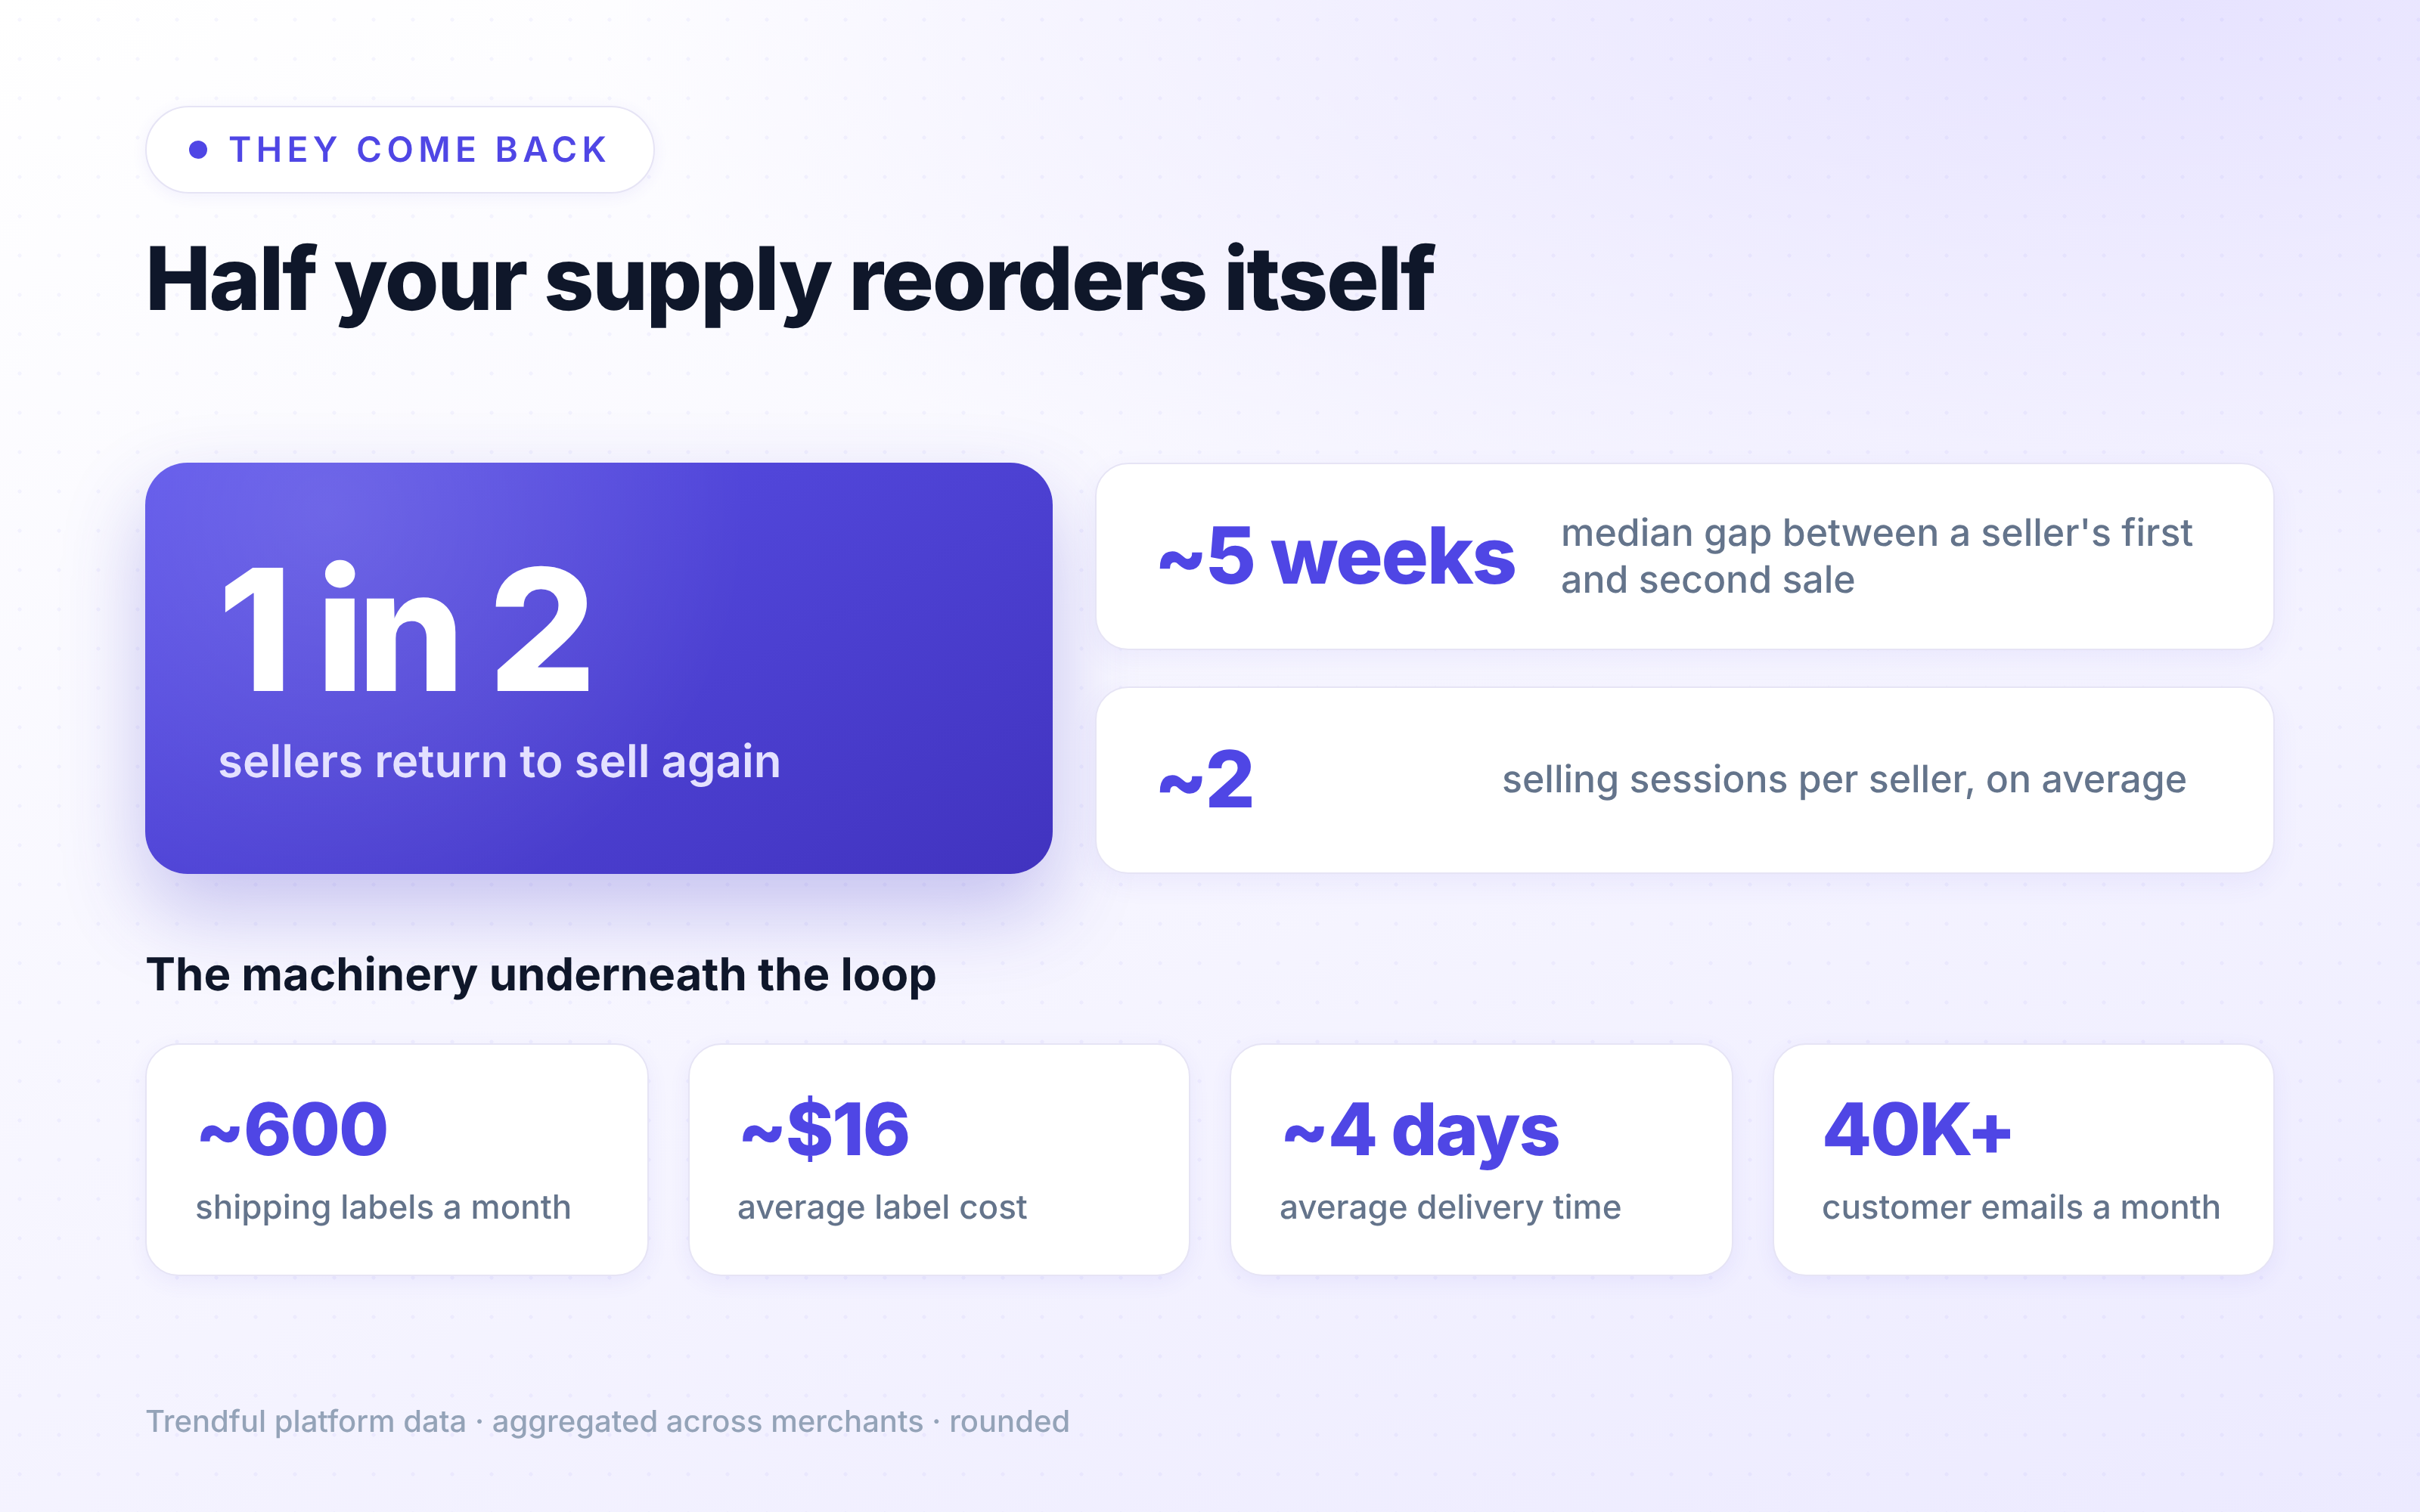
The operations underneath that loop are not glamorous, but they are what earns the return visit. Merchants on the platform generate roughly 600 shipping labels a month at about $16 on average, with items arriving in about 4 days, and send over 40,000 customer emails a month. Inbound shipping that just works, communication that stays organized on one thread, and a clean return flow for declined items are the unglamorous machinery that turns a first sale into a fifth.
What we think happens next
Predictions, clearly labeled as ours rather than measured, since the data above only tells us where things stand today.
Supply growth looks durable. The seasonal rhythm is stable, the two-year slope is up and to the right, and nothing we see suggests the pool of sellable closets is thinning. We expect the acquisition-from-your-own-customers model to keep taking share from wholesale and auctions, because it is the only sourcing channel that compounds instead of resetting every month.
We expect store credit and trade-in to grow as a share of tender, because merchants are learning that a seller paid in credit is already their next buyer. And we expect pricing discipline to separate the operators who scale from the ones who stall: the acceptance-versus-payout split by brand shows how differently sellers behave depending on what they are selling, and the merchants who read that correctly will win more supply at better margins. The data moat, not the storefront, is where the next advantage sits.
Frequently asked questions
How big is the C2B resale market? We cannot speak for the whole industry, only for our platform. On Trendful, roughly 50,000 seller accounts have submitted close to 200,000 items, with 6,200+ new items a month and over $20M in merchandise value submitted monthly. Treat that as a view into serious operators, not an industry census.
Do most sellers want cash or store credit? Cash, by a wide margin. Across a recent sample of accepted offers, about 96% were paid in cash and roughly 4% in store credit. Store credit is small in volume but strategically useful, because a seller paid in credit is already set up to become a buyer.
Do resale sellers come back? About 1 in 2 return to sell again, with a median of roughly five weeks between a first and second submission and about two selling sessions per seller. The returning relationship is the engine of C2B supply, which is why the quality of the selling experience matters so much.
Which brands get the highest offers? Among the most-submitted brands on the platform, Hermès carries the highest median offer, around $2,800, followed by Chanel near $1,950. But a high offer does not mean a quick yes: Coach sellers, offered a median near $115, accept about 73% of the time, while Hermès sellers accept about 42%. Higher-value sellers negotiate and shop around.
Is this data representative of all resale? No, and we want to be clear about it. It reflects merchants who run on Trendful and skew toward established, high-performing operations. It is reported only in aggregate, never by individual merchant, and is best read as a window into how serious resale desks operate rather than a measurement of the entire market.
Sources
- All figures are Trendful platform data, aggregated across merchants and rounded for readability. They reflect operators on Trendful, who skew toward established, high-performing resale businesses, and are not an industry-wide census. Numbers are drawn from recent measurement windows and are not exact point-in-time counts.
Get started
Want to see the offer view, the seller experience, and the platform data behind a C2B operation? Create an account and pick the plan that fits how you operate today, or book a demo and we will walk you through it.
Keep reading
- Consistency beats volume: how to market a resale business
Three posts a week you can sustain beats seven you burn out on. Here is how to market a resale business organically: which platforms do…
- Where to sell pre-owned inventory: marketplace fees vs your own storefront
Most operators pick a sales channel on audience fit and never run the math on what a typical sale nets. Here is where to sell pre-owned…
- How to start a resale business: the complete playbook
Secondhand is on track for about $393 billion by 2030 and growing twice as fast as apparel retail. The opportunity is not the hard part…